Optimizing the green hydrogen value chain from regional to national scale

Back
Introduction
Green hydrogen transition is one of the alternative pathways for mobility and industry decarbonization. First, being a zero-emission solution, more and more applications are considering hydrogen for the conversion of traditional fossil-fuel based processes like in the hard-to-abate industries(e.g., refineries, petrochemicals, steel making industries, etc.) or technologies like in the mobility sector.
Second, the future energy system is expected to be characterized by an growing penetration of unforecastable and uncontrollable renewable energy sources. Therefore, as batteries, green hydrogen production can support Transmission System Operators (TSOs) in balancing their networks in case of energy demand and generation mismatch.
However, hydrogen economy potential still faces against the lack of supply chain, from renewable energy generation, to hydrogen production and utilization through different transport and delivery modes. To minimize the techno-economic performance gap with tradtioinal and well-known technologies relies on dedicated optimization tools.
In the SuperP2G project, CNR-ITAE and the University of Bologna developed a new Geographic Information System (GIS) based tool to investigate the optimum size, location and operations of Power to Hydrogen (P2H) plants to match hydrogen demand and renewable energy plants.
The tool offers a useful support towards the energy transition to every interested stakeholder. In fact, no geographical limitation applies. The tool can be applied to all the usecases where a green hydrogen demand is present and known. For exmaple, Apulia, a region in the south of Italy was selected as a first demonstration during the project. The choice was motivated because of the high renewable energy penetration., the connection with important natural gas infrastructure and the high potential of hydrogen demand of local hard-to-abate industries. Second, although the case study focuses on the final production of green hydrogen, the tool can be easily asked to investigate other Power to Gas (P2G) pathways simply by changing techno-economic solving parameters.
In the following sections the methodology and the application to a specific case study are shown. Specifically, the P2H plants' location s and size to supply a future hydrogen mobility in a low penetration scenario is shown. At first, the focus is at regional scale, then, extended to the overall national territory focusing on Italian highways.
Objective
The research aimed at developing a mathematical and GIS integrated tool to optimize the size and the location for a set of Power to Hydrogen (P2H) plants in Puglia region territory(i.e., SuperP2G italian case study). Georeferenced information from GIS and additional databases (mainly institutional / public) were used to feed the implemented algorithms (whose details are listed below) that operates on energy infrastructures (networks and plants) nominal variables (i.e., electrical power generation, hydrogen demand) and their positions and geometries. The tool allowed to find an optimal solution of the transshipment problem customized on a sector coupling case study.
Methodology
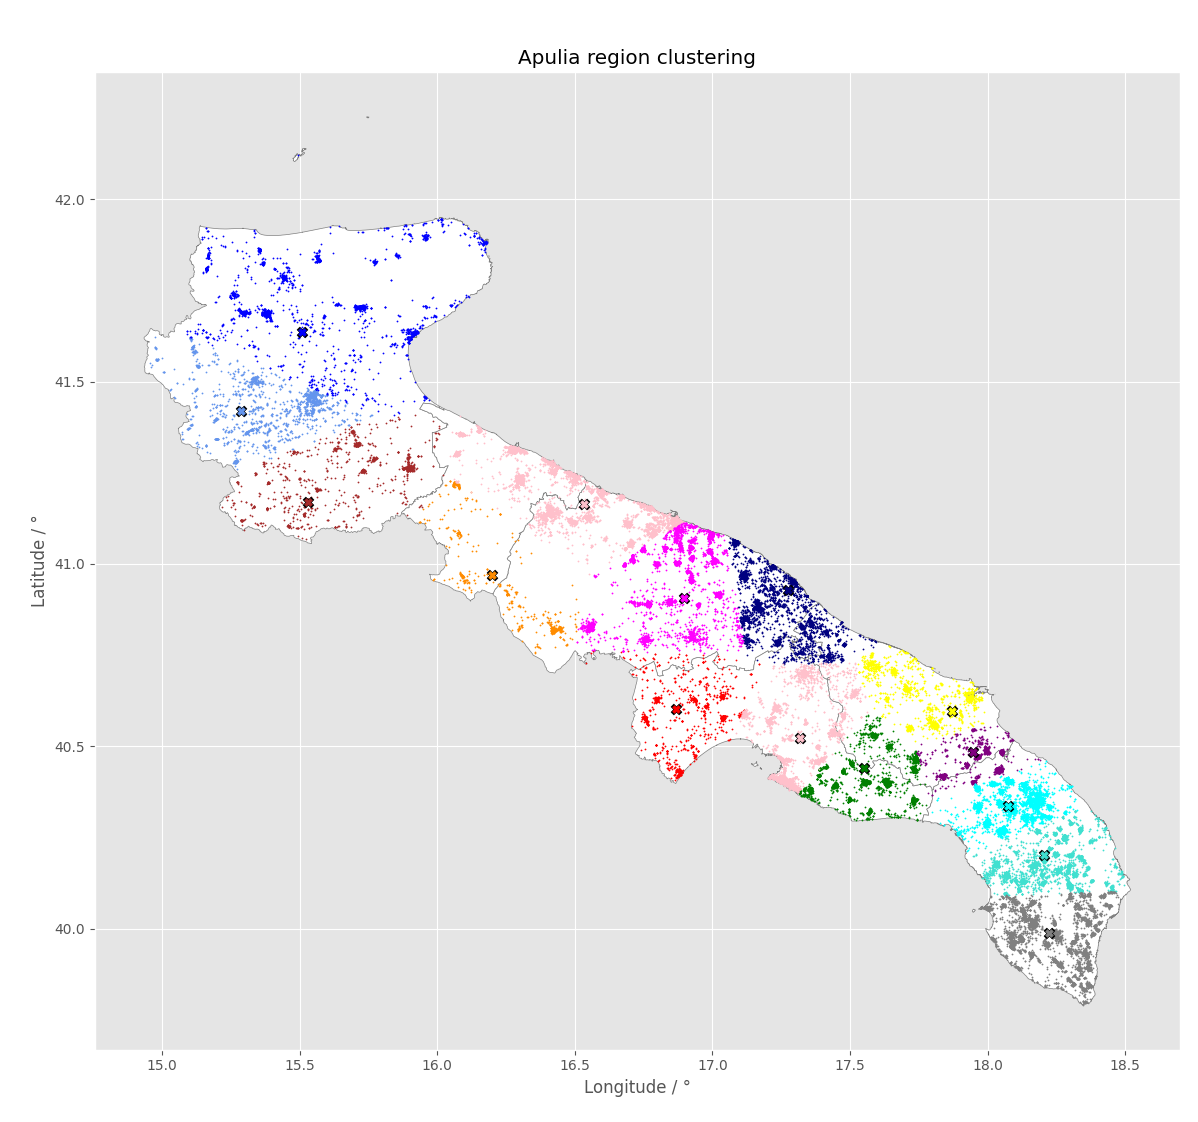
The clustering procedure was based on k-means technique and implemented in Python through the scikit-lab package. About 47000 generation plants were aggregated into 20 clusters ( indeed the number of cluster was varied for different simulations)
 Figure 1: Clustering procedure results on Apulia territory.
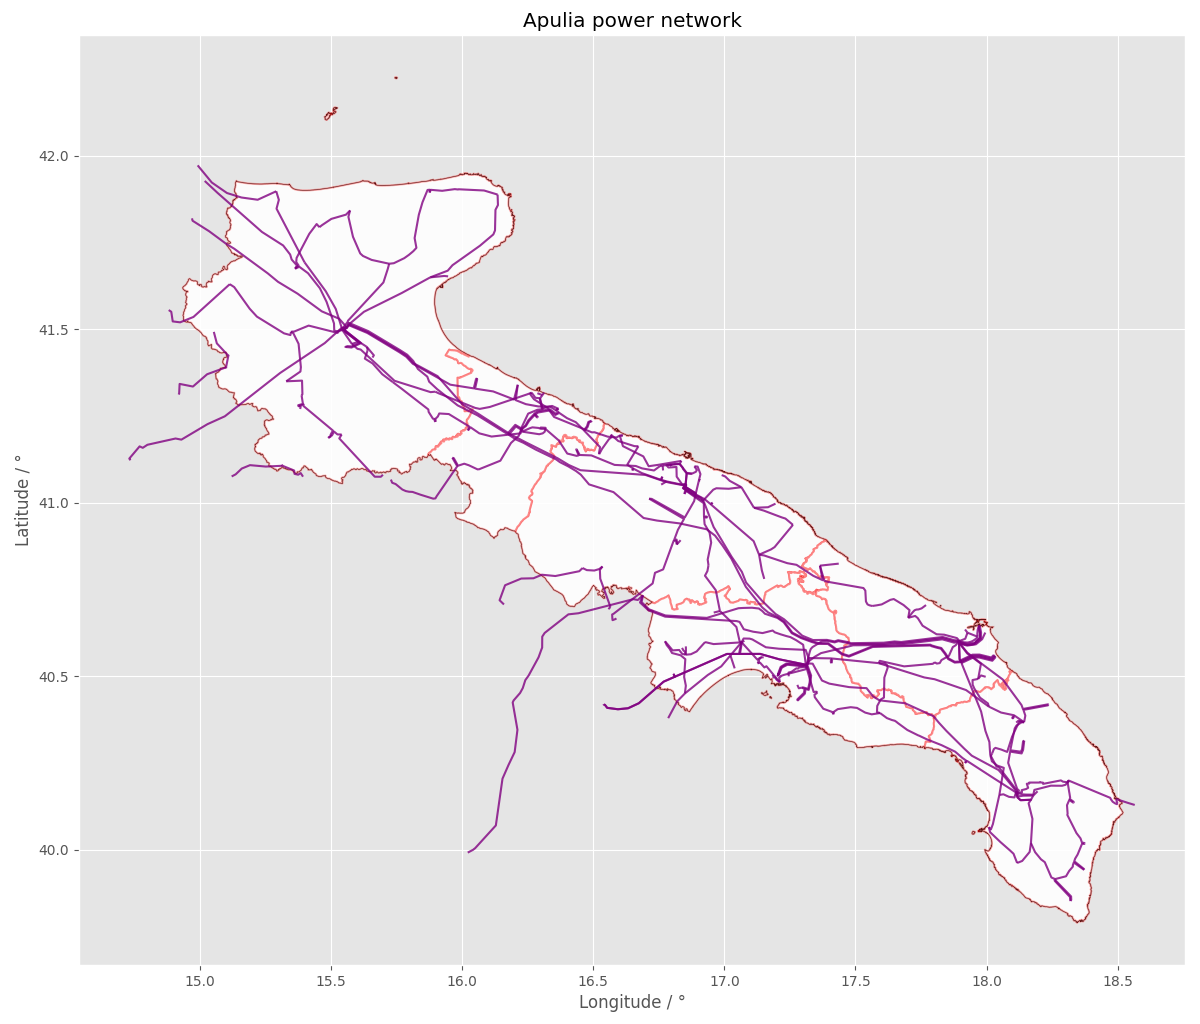
GIS data (e.g., from shapefiles) about infrastructure like power network( sketched in the pictures below) were used to extract geometries laying in Apulia to calculate distance and costs.
 Figure 2: Power networks GIS data for connection cost calculation.
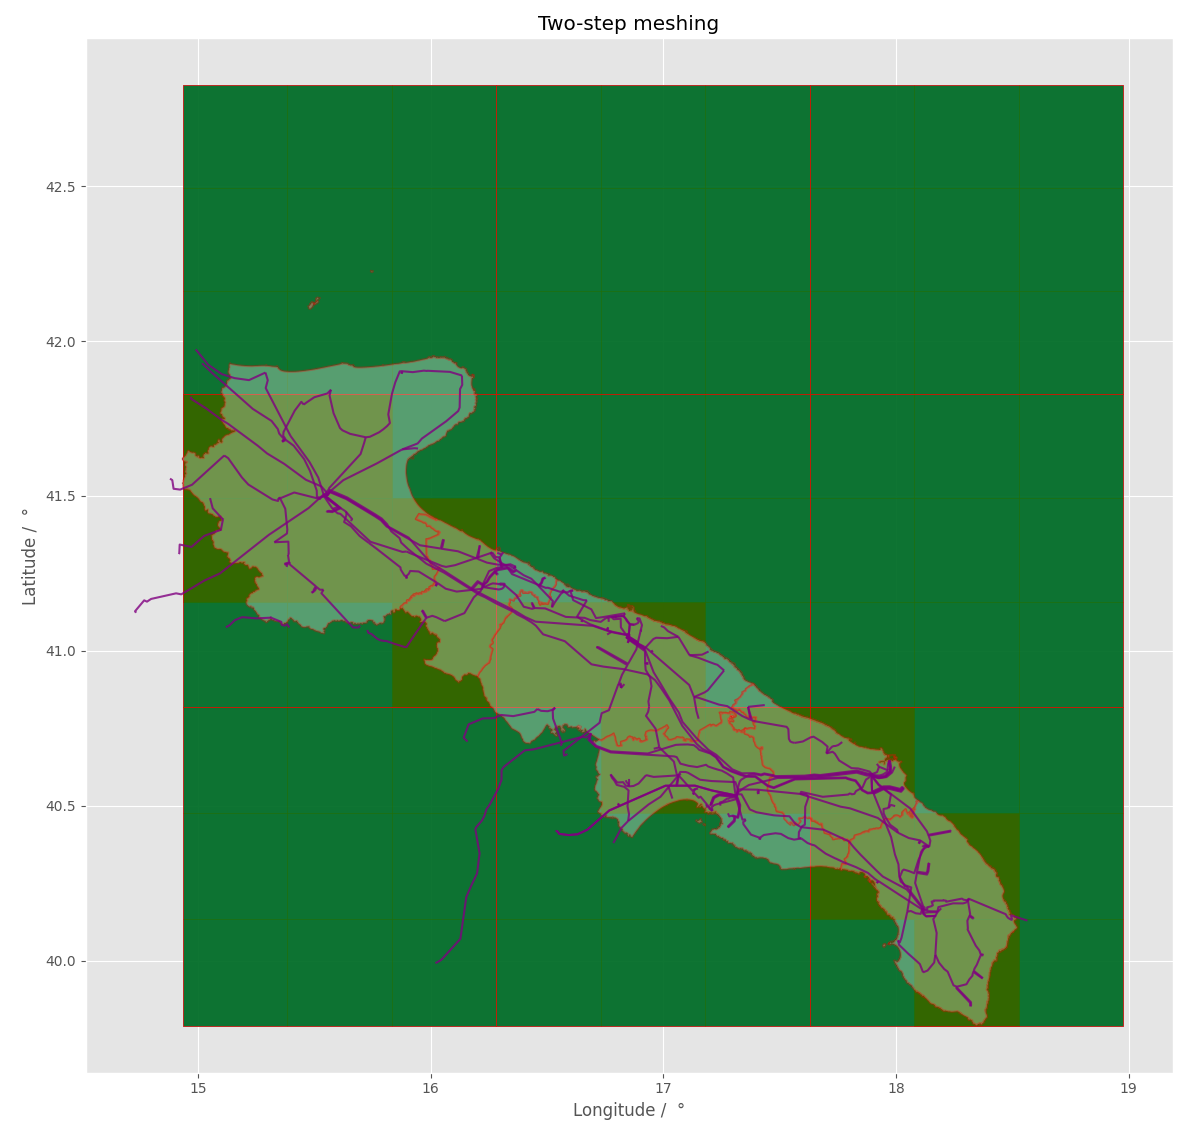
The meshing procedure was performed in two steps: the former with large tiles to exclude parts of the boundary box (the rectangle containing the Puglia territory) almost outside the land, the latter, meshing inside the not-excluded tiles, to define a grid for the eligible P2G plants positions.
 Figure 3: Meshing creation and data overlaying.
A low hydrogen penetration scenario in the mobility sector was investigated. The parameters used to characterize the current scenario are shown below.
- Hydrogen penetration: the parameters will depend on H2 penetration in the mobility market. As shown, in 2030 a penetration of 0,5% is assumed.
- O2H plant nominal size: because of the scale effect, i.e., a lower specific cost with increasing the nominal size, different plant sizes are investigated by the tool. As a preliminary assumption, a range between 0 and 150 MW is considered.
- A maximum daily distance covered by a truck for hydrogen transportation equal to 500 km was preliminary assumed.
Results
Then, using the clusters centroids as generation points, the mesh centroids as eligible positions, and the identified
users (hydrogen refueling stations, HRSs) as hydrogen destination points, the transshipment problem was solved with the
above mentioned constraints.
The problem formulation resulted in a graph representation of the overall overlay networks and solved through a Python
sript based on pyomo module an dGurobi as solver. The representation of the found solution for the investigated scenario
is reported below as bouth geographic collocation of the conversion plants (and the other Points of Interest positions)
and bar plots to highlight the cost breakdown, including CAPEX hydrogen transportation and power network connection
costs. As shown, CAPEX is responsible for the biggest contribution to the final cost hydrogen even if in some cases
transport accounts for almost the 50%.
Figure 4: GIS Map representation of the output solution of the tool for the Puglia region case study.
 Figure 5: Overall Cost breakdown for each P2G plant, including hydrogen transportation costs to reach the HRS
It is reported for each P2G plant the percentage referred to the single cost items (CAPEX, Power network connection cost
and H2 delivery to the HRSs).
A similar approach has been used to extend the optimization to the entire Italian territory, where the main HRSs present
in the highway network have been considered.
The results of the scenario are shown in a developed online platform at unibo
 Figure 6: SuperP2G Italian tool: national case study on hydrogen mobility sector at http://unibo-din.g3wsuite.it/it/map/superp2g-italy-project/qdjango/3/
In the Figure 6:
- markers in light blue represent the renewable energy source activated to supply green electricity to P2H plants, in black the ones not used
- yellow circles represent the P2g plants
- red circles represent the assumed HRS along the regional road network
Conclusion
SuperP2G-Italy tool covers an existing gap in Power to Gas research. The tool is an effective instrument for investment decision planning helping to select the best size and location and also to easily perform sensitivity analysis changing the interested parameters. The tool was tested and validated in two different case studies at national and regional level considering the mobility as the potential end users.
The two case studies have been carried out and presented in this page. Numerical simulations demonstrated that in the csae of national mobility application (low penetration hypothesis) the Levelized Cost of Hydrogen (LCOH) ranges between 6.93 €/kg and 7.46 €/kg. These values are significantly higher than the current LCOH of hydrogen produced by steam Methane Reforming process (from natural gas), but lower than the current LCOH calculated for green hydrogen.
As a comparison, hydrogen mobility would be more convenient than gasoline, diesel, and PLG only if their purchase cost s exceeded 1.34-2.13, 1.52-2.42, and 1.07-1.71 €/liter, respectively. Research activities are still ongoning to imporve the functionalities fo the tool such as the definition of other standardized P2G plants' configurations and multi-criteria approaches to rank the possible positions.
References
Guzzini, A.; Brunaccini, G.; Aloisio, D.; Pellegrini, M.; Saccani, C.; Sergi, F. A New Geographic Information System (GIS) Tool for Hydrogen Value Chain Planning Optimization: Application to Italian Highways. Sustainability 2023, 15, 2080. https://doi.org/10.3390/su15032080
Authors
Giovanni Brunaccini | Alessandro Guzzini | Davide Aloisio | Marco Pellegrini | Cesare Saccani | Francesco Sergi